Observability
Understand how to gain end-to-end visibility of a Kubernetes cluster through the collection of metrics, logs, and traces.
In Kubernetes, observability is the process of collecting and analyzing metrics, logs, and traces—often referred to as the three pillars of observability—in order to obtain a better understanding of the internal state, performance, and health of the cluster.
Kubernetes control plane components, as well as many add-ons, generate and emit these signals. By aggregating and correlating them, you can gain a unified picture of the control plane, add-ons, and applications across the cluster.
Figure 1 outlines how cluster components emit the three primary signal types.
flowchart LR
A[Cluster components] --> M[Metrics pipeline]
A --> L[Log pipeline]
A --> T[Trace pipeline]
M --> S[(Storage and analysis)]
L --> S
T --> S
S --> O[Operators and automation]
Figure 1. High-level signals emitted by cluster components and their consumers.
Metrics
Kubernetes components emit metrics in Prometheus format from their /metrics endpoints, including:
- kube-controller-manager
- kube-proxy
- kube-apiserver
- kube-scheduler
- kubelet
The kubelet also exposes metrics at /metrics/cadvisor, /metrics/resource, and /metrics/probes, and add-ons such as kube-state-metrics enrich those control plane signals with Kubernetes object status.
A typical Kubernetes metrics pipeline periodically scrapes these endpoints and stores the samples in a time series database (for example with Prometheus).
See the system metrics guide for details and configuration options.
Figure 2 outlines a common Kubernetes metrics pipeline.
flowchart LR
C[Cluster components] --> P[Prometheus scraper]
P --> TS[(Time series storage)]
TS --> D[Dashboards and alerts]
TS --> A[Automated actions]
Figure 2. Components of a typical Kubernetes metrics pipeline.
For multi-cluster or multi-cloud visibility, distributed time series databases (for example Thanos or Cortex) can complement Prometheus.
See Common observability tools - metrics tools for metrics scrapers and time series databases.
See Also
- System metrics for Kubernetes components
- Resource usage monitoring with metrics-server
- kube-state-metrics concept
- Resource metrics pipeline overview
Logs
Logs provide a chronological record of events inside applications, Kubernetes system components, and security-related activities such as audit logging.
Container runtimes capture a containerized application’s output from standard output (stdout) and standard error (stderr) streams. While runtimes implement this differently, the integration with the kubelet is standardized through the CRI logging format, and the kubelet makes these logs available through kubectl logs.
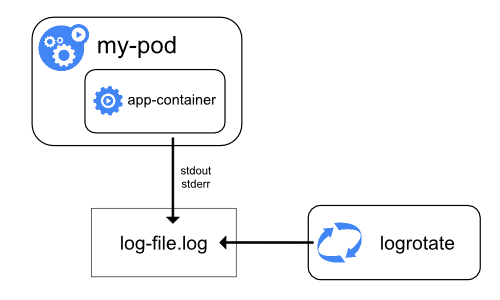
Figure 3a. Node-level logging architecture.
System component logs capture events from the cluster and are often useful for debugging and troubleshooting. These components are classified in two different ways: those that run in a container and those that do not. For example, the kube-scheduler and kube-proxy usually run in containers, whereas the kubelet and the container runtime run directly on the host.
- On machines with
systemd, the kubelet and container runtime write to journald. Otherwise, they write to.logfiles in the/var/logdirectory. - System components that run inside containers always write to
.logfiles in/var/log, bypassing the default container logging mechanism.
System component and container logs stored under /var/log require log rotation to prevent uncontrolled growth. Some cluster provisioning scripts install log rotation by default; verify your environment and adjust as needed. See the system logs reference for details on locations, formats, and configuration options.
Most clusters run a node-level logging agent (for example, Fluent Bit or Fluentd) that tails these files and forwards entries to a central log store. The logging architecture guidance explains how to design such pipelines, apply retention, and log flows to backends.
Figure 3 outlines a common log aggregation pipeline.
flowchart LR
subgraph Sources
A[Application stdout / stderr]
B[Control plane logs]
C[Audit records]
end
A --> N[Node log agent]
B --> N
C --> N
N --> L[Central log store]
L --> Q[Dashboards, alerting, SIEM]
Figure 3. Components of a typical Kubernetes logs pipeline.
See Common observability tools - logging tools for logging agents and central log stores.
See Also
Traces
Traces capture how requests moves across Kubernetes components and applications, linking latency, timing and relationships between operations.By collecting traces, you can visualize end-to-end request flow, diagnose performance issues, and identify bottlenecks or unexpected interactions in the control plane, add-ons, or applications.
Kubernetes 1.35 can export spans over the OpenTelemetry Protocol (OTLP), either directly via built-in gRPC exporters or by forwarding them through an OpenTelemetry Collector.
The OpenTelemetry Collector receives spans from components and applications, processes them (for example by applying sampling or redaction), and forwards them to a tracing backend for storage and analysis.
Figure 4 outlines a typical distributed tracing pipeline.
flowchart LR
subgraph Sources
A[Control plane spans]
B[Application spans]
end
A --> X[OTLP exporter]
B --> X
X --> COL[OpenTelemetry Collector]
COL --> TS[(Tracing backend)]
TS --> V[Visualization and analysis]
Figure 4. Components of a typical Kubernetes traces pipeline.
See Common observability tools - tracing tools for tracing collectors and backends.
See Also
- System traces for Kubernetes components
- OpenTelemetry Collector getting started guide
- Monitoring and tracing tasks
Common observability tools
Note: This section links to third party projects that provide functionality required by Kubernetes. The Kubernetes project authors aren't responsible for these projects, which are listed alphabetically. To add a project to this list, read the content guide before submitting a change. More information.
Note: This section links to third-party projects that provide observability capabilities required by Kubernetes. The Kubernetes project authors aren't responsible for these projects, which are listed alphabetically. To add a project to this list, read the content guide before submitting a change.
Metrics tools
- Cortex offers horizontally scalable, long-term Prometheus storage.
- Grafana Mimir is a Grafana Labs project that provides multi-tenant, horizontally scalable Prometheus-compatible storage.
- Prometheus is the monitoring system that scrapes and stores metrics from Kubernetes components.
- Thanos extends Prometheus with global querying, downsampling, and object storage support.
Logging tools
- Elasticsearch delivers distributed log indexing and search.
- Fluent Bit collects and forwards container and node logs with a low resource footprint.
- Fluentd routes and transforms logs to multiple destinations.
- Grafana Loki stores logs in a Prometheus-inspired, label-based format.
- OpenSearch provides open source log indexing and search compatible with Elasticsearch APIs.
Tracing tools
- Grafana Tempo offers scalable, low-cost distributed tracing storage.
- Jaeger captures and visualizes distributed traces for microservices.
- OpenTelemetry Collector receives, processes, and exports telemetry data including traces.
- Zipkin provides distributed tracing collection and visualization.
What's next
- Learn how to collect resource usage metrics with metrics-server
- Explore logging tasks and tutorials
- Follow the monitoring and tracing task guides
- Review the system metrics guide for component endpoints and stability
- Review the common observability tools section for vetted third-party options
Last modified September 23, 2025 at 1:49 AM PST: docs: add observability overview page (d3ceb4dfd5)
Items on this page refer to third party products or projects that provide functionality required by Kubernetes. The Kubernetes project authors aren't responsible for those third-party products or projects. See the CNCF website guidelines for more details.
You should read the content guide before proposing a change that adds an extra third-party link.